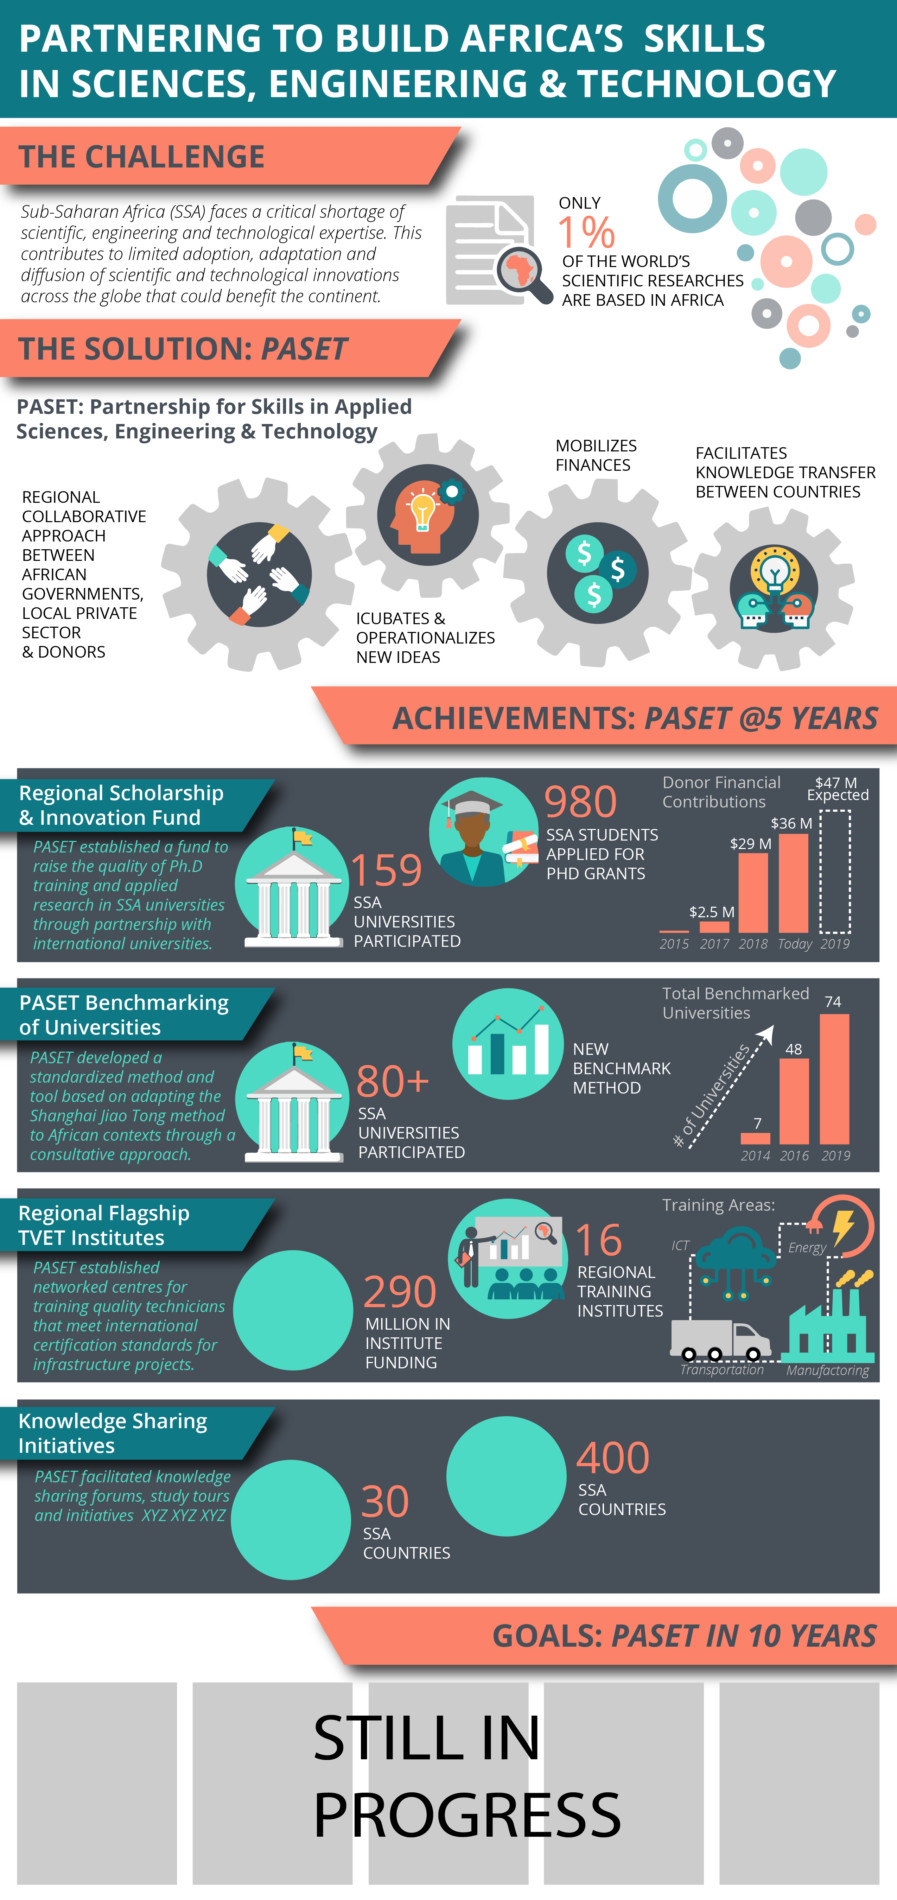
Infographic on Program Results
I created this infographic in order to demonstrate how the program could share their M&E results from the past five years as well as their goals for the next 10 years. The graphic is ~75% complete, but gives an overview of the style and type of infrographic I can create to demonstrate research findings, M&E results or any type of results and data you are trying to communicate to your target audience.